In this article, we will look into the built-in logging features of IIS 7 and 7.5 to log request details. An IIS log is a useful resource to troubleshoot requests. In IIS 7 and 7.5, we can log the details of a request, such as client IP, time taken, response size, cookie and so on into a file. This information helps to find the load on the server in terms of number of requests, size and time taken to serve the request.

Let's open IIS, configure logging for a website and analyze it. We can configure logging at server level or website level. Let's do it at the website level. Go to Default Web Site, go to the Logging feature and click "Enable":
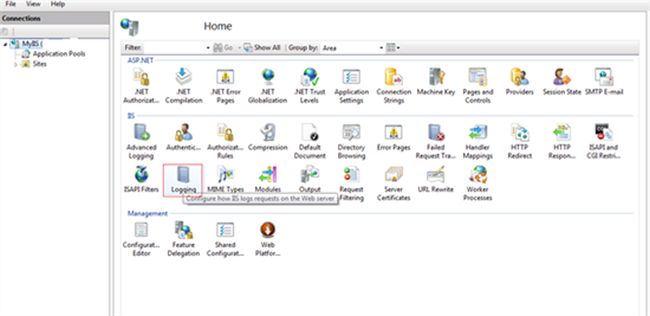
In the following Logging dialog, we can configure the format of the log file, it can be:
- IIS: IIS log file format is a fixed ASCII text-based format, so you cannot customize it (Can't select fields) and fields are separated by commas.
- W3C (default format): It is a customizable ASCII text-based format. You can use IIS Manager to select which fields to include in the log file and fields are separated by spaces.
- NCSA: its log file format is a fixed ASCII text-based format, so you cannot customize it and contains less information than an IIS log format.
- Custom: ODBC logging is implemented as a custom logging module and helps to log information into ODBC-compliant databases like SQL Server or Microsoft Access.
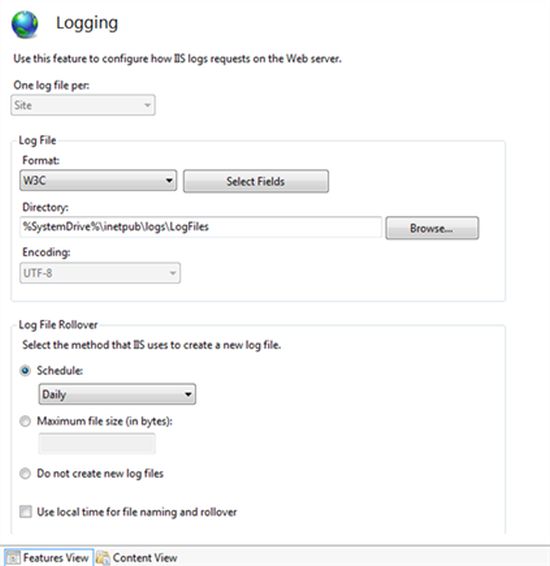
Select W3C as log format, click on "Select Fields" and choose the fields that need to be logged in the log file.
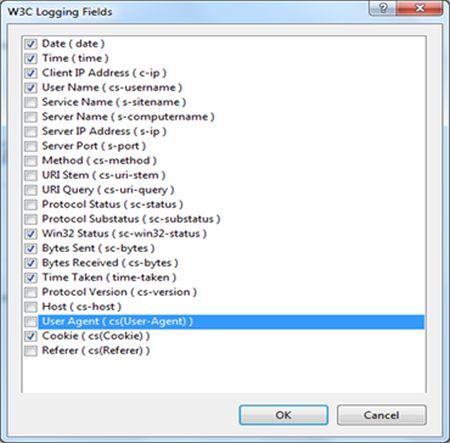
We can set the location or directory for the log files, set options to create a new log file based on file size, daily or weekly and so on. When we check "Use local time for file naming and rollover" it will use the local server time instead of UTC for log file naming and time for log file rollover. This setting will not affect the time field format of the request logged in the file and uses UTC time format.
Let's may a request to welcome.png present in the Default Web Site and analyze the log file. This log file will be under the path set in the Logging Feature + W3SVC<website identifier>. In my case, it is "C:\inetpub\logs\LogFiles\W3SVC1" and contains the following information:

Most of the fields are self-explanatory and field prefixes have the following meanings:
s- Server actions
c- Client actions
cs- Client-to-server actions
sc- Server-to-client actions
sc-bytes - response size
cs-bytes - request size.
The Time-taken field will show the total time taken to generate the response as well as the time to send the complete response to the client until the last byte. This is done by taking into account the last ACK from the answer to the response. Let's say a request took 5000 milliseconds to generate the response and 3000 milliseconds to send the complete response to the client, so it will show time-taken as 8000 milliseconds.
Most of the preceding logging features are also available on a FTP site as well. In most of the cases, your log file will be very large and can't be analyzed in a notepad. In that scenario, we can use the Log Parser (Available here). Let's install it and open our log file as shown below:
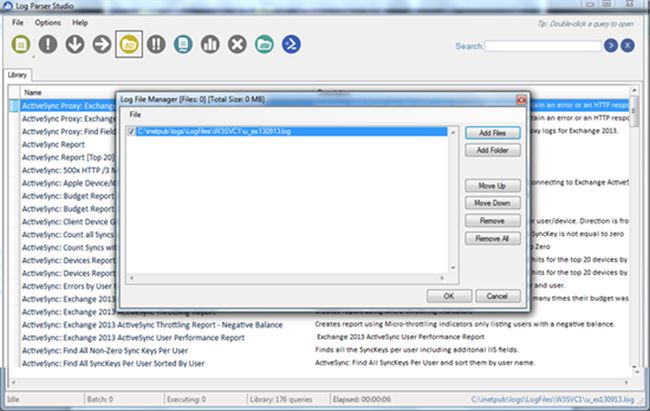
Click on New Query from File Menu and select Log type as IISW3CLOG and hit F5. The result will be as shown below:
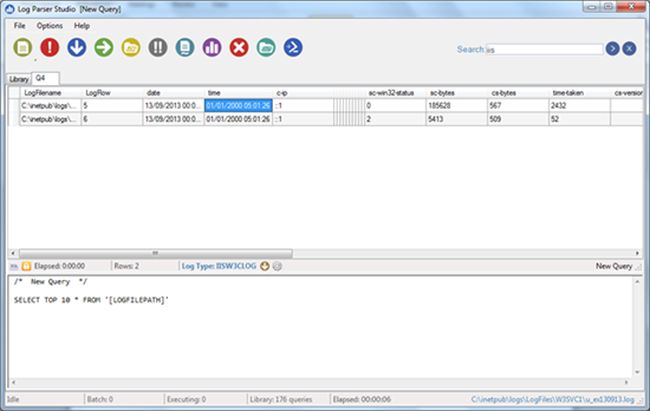
We can even write our own queries in SQL syntax to filter the data:
SELECT TOP 10 * FROM '[LOGFILEPATH]' where time-taken >100
As well, there are a few sets of built-in queries for IIS in the Library tab as shown below:
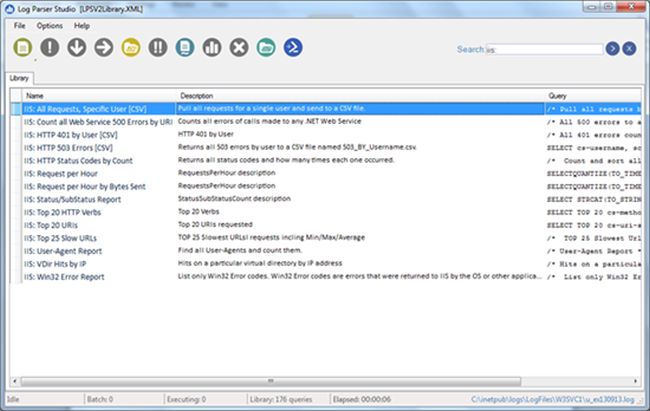
By using the Log Parser Studio, we can analyse large log files to determine load and performance issues at the page or user level. We can use IIS logs as a first step to troubleshoot performance issues. This log helps us to determine any performance issues that exist or not. If any exist then which page is taking time to respond and so on. I will end this article, by mentioning tools helpful in troubleshooting IIS issues in scenarios like a crash, hang, high CPU or memory and so on (we will discuss the following tools in depth in future articles):
IIS Logging
IIS Advanced Logging
FREB Tracing [Failed Request Tracing]
Fiddler or IE Developer Tools
Memory dumps collection ofw3wp.exe using Debug Diag or AD Plus.
Memory dumps analysis using WinDbg tool.
I hope this article will be helpful for all.